BlueScreenView
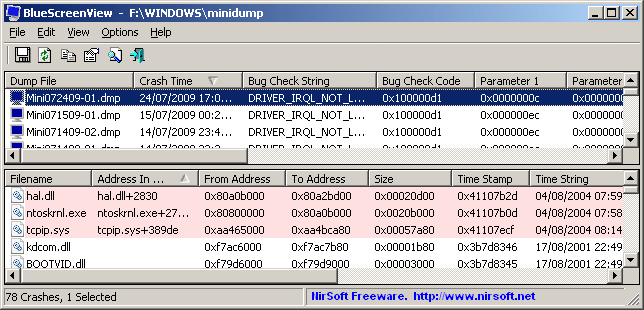
BlueScreenView scans all your minidump files created during 'blue screen of death' crashes, and displays the information about all crashes in one table. For each crash, BlueScreenView displays the minidump filename, the date/time of the crash, the basic crash information displayed in the blue screen (Bug Check Code and 4 parameters), and the details of the driver or module that possibly caused the crash (filename, product name, file description, and file version).
For each crash displayed in the upper pane, you can view the details of the device drivers loaded during the crash in the lower pane. BlueScreenView also mark the drivers that their addresses found in the crash stack, so you can easily locate the suspected drivers that possibly caused the crash.
下載點


BlueScreenView Features
Automatically scans your current minidump folder and displays the list of all crash dumps, including crash dump date/time and crash details.
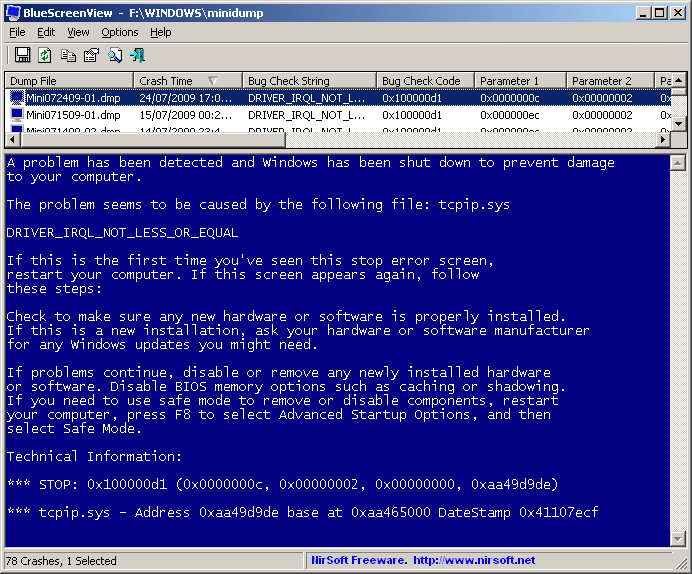
Allows you to view a blue screen which is very similar to the one that Windows displayed during the crash.
BlueScreenView enumerates the memory addresses inside the stack of the crash, and find all drivers/modules that might be involved in the crash.
BlueScreenView also allows you to work with another instance of Windows, simply by choosing the right minidump folder (In Advanced Options).
BlueScreenView automatically locate the drivers appeared in the crash dump, and extract their version resource information, including product name, file version, company, and file description.
System Requirements
BlueScreenView works with Windows XP, Windows Server 2003, Windows Server 2008, Windows Vista, and Windows 7, as long as Windows is configured to save minidump files during BSOD crashes.
BlueScreenView can read the MiniDump files of both 32-bit and x64 systems.
Using BlueScreenView
BlueScreenView doesn't require any installation process or additional dll files. In order to start using it, simply run the executable file - BlueScreenView.exe
After running BlueScreenView, it automatically scans your MiniDump folder and display all crash details in the upper pane.
Crashes Information Columns (Upper Pane)
Dump File: The MiniDump filename that stores the crash data.
Crash Time: The created time of the MiniDump filename, which also matches to the date/time that the crash occurred.
Bug Check String: The crash error string. This error string is determined according to the Bug Check Code, and it's also displayed in the blue screen window of Windows.
Bug Check Code: The bug check code, as displayed in the blue screen window.
Parameter 1/2/3/4: The 4 crash parameters that are also displayed in the blue screen of death.
Caused By Driver: The driver that probably caused this crash. BlueScreenView tries to locate the right driver or module that caused the blue screen by looking inside the crash stack. However, be aware that the driver detection mechanism is not 100% accurate, and you should also look in the lower pane, that display all drivers/modules found in the stack. These drivers/modules are marked in pink color.
Caused By Address: Similar to 'Caused By Driver' column, but also display the relative address of the crash.
File Description: The file description of the driver that probably caused this crash. This information is loaded from the version resource of the driver.
Product Name: The product name of the driver that probably caused this crash. This information is loaded from the version resource of the driver.
Company: The company name of the driver that probably caused this crash. This information is loaded from the version resource of the driver.
File Version: The file version of the driver that probably caused this crash. This information is loaded from the version resource of the driver.
Drivers Information Columns (Lower Pane)
Filename: The driver/module filename
Address In Stack: The memory address of this driver that was found in the stack.
From Address: First memory address of this driver.
To Address: Last memory address of this driver.
Size: Driver size in memory.
Time Stamp: Time stamp of this driver.
Time String: Time stamp of this driver, displayed in date/time format.
Product Name: Product name of this driver, loaded from the version resource of the driver.
File Description: File description of this driver, loaded from the version resource of the driver.
File Version: File version of this driver, loaded from the version resource of the driver.
Company: Company name of this driver, loaded from the version resource of the driver.
Full Path: Full path of the driver filename.
Lower Pane Modes
Currently, the lower pane has 3 different display modes. You can change the display mode of the lower pane from Options->Lower Pane Mode menu.
All Drivers: Displays all the drivers that were loaded during the crash that you selected in the upper pane. The drivers/module that their memory addresses found in the stack, are marked in pink color.
Only Drivers Found In Stack: Displays only the modules/drivers that their memory addresses found in the stack of the crash. There is very high chance that one of the drivers in this list is the one that caused the crash.
Blue Screen in XP Style: Displays a blue screen that looks very similar to the one that Windows displayed during the crash.
Crashes of Remote Network Computer
If you have multiple computers on your network and you have full administrator access to them (e.g: you have access to \\ComputerName\c$), you can also view the crashes of the other computers on your network remotely. In order to do that, simply go to 'Advanced Options' (Ctrl+O) and type the MiniDump folder of the remote computer, for example: \\MyComp\c$\Windows\MiniDump.
For each crash displayed in the upper pane, you can view the details of the device drivers loaded during the crash in the lower pane. BlueScreenView also mark the drivers that their addresses found in the crash stack, so you can easily locate the suspected drivers that possibly caused the crash.
下載點


BlueScreenView Features
Automatically scans your current minidump folder and displays the list of all crash dumps, including crash dump date/time and crash details.
Allows you to view a blue screen which is very similar to the one that Windows displayed during the crash.
BlueScreenView enumerates the memory addresses inside the stack of the crash, and find all drivers/modules that might be involved in the crash.
BlueScreenView also allows you to work with another instance of Windows, simply by choosing the right minidump folder (In Advanced Options).
BlueScreenView automatically locate the drivers appeared in the crash dump, and extract their version resource information, including product name, file version, company, and file description.
System Requirements
BlueScreenView works with Windows XP, Windows Server 2003, Windows Server 2008, Windows Vista, and Windows 7, as long as Windows is configured to save minidump files during BSOD crashes.
BlueScreenView can read the MiniDump files of both 32-bit and x64 systems.
Using BlueScreenView
BlueScreenView doesn't require any installation process or additional dll files. In order to start using it, simply run the executable file - BlueScreenView.exe
After running BlueScreenView, it automatically scans your MiniDump folder and display all crash details in the upper pane.
Crashes Information Columns (Upper Pane)
Dump File: The MiniDump filename that stores the crash data.
Crash Time: The created time of the MiniDump filename, which also matches to the date/time that the crash occurred.
Bug Check String: The crash error string. This error string is determined according to the Bug Check Code, and it's also displayed in the blue screen window of Windows.
Bug Check Code: The bug check code, as displayed in the blue screen window.
Parameter 1/2/3/4: The 4 crash parameters that are also displayed in the blue screen of death.
Caused By Driver: The driver that probably caused this crash. BlueScreenView tries to locate the right driver or module that caused the blue screen by looking inside the crash stack. However, be aware that the driver detection mechanism is not 100% accurate, and you should also look in the lower pane, that display all drivers/modules found in the stack. These drivers/modules are marked in pink color.
Caused By Address: Similar to 'Caused By Driver' column, but also display the relative address of the crash.
File Description: The file description of the driver that probably caused this crash. This information is loaded from the version resource of the driver.
Product Name: The product name of the driver that probably caused this crash. This information is loaded from the version resource of the driver.
Company: The company name of the driver that probably caused this crash. This information is loaded from the version resource of the driver.
File Version: The file version of the driver that probably caused this crash. This information is loaded from the version resource of the driver.
Drivers Information Columns (Lower Pane)
Filename: The driver/module filename
Address In Stack: The memory address of this driver that was found in the stack.
From Address: First memory address of this driver.
To Address: Last memory address of this driver.
Size: Driver size in memory.
Time Stamp: Time stamp of this driver.
Time String: Time stamp of this driver, displayed in date/time format.
Product Name: Product name of this driver, loaded from the version resource of the driver.
File Description: File description of this driver, loaded from the version resource of the driver.
File Version: File version of this driver, loaded from the version resource of the driver.
Company: Company name of this driver, loaded from the version resource of the driver.
Full Path: Full path of the driver filename.
Lower Pane Modes
Currently, the lower pane has 3 different display modes. You can change the display mode of the lower pane from Options->Lower Pane Mode menu.
All Drivers: Displays all the drivers that were loaded during the crash that you selected in the upper pane. The drivers/module that their memory addresses found in the stack, are marked in pink color.
Only Drivers Found In Stack: Displays only the modules/drivers that their memory addresses found in the stack of the crash. There is very high chance that one of the drivers in this list is the one that caused the crash.
Blue Screen in XP Style: Displays a blue screen that looks very similar to the one that Windows displayed during the crash.
Crashes of Remote Network Computer
If you have multiple computers on your network and you have full administrator access to them (e.g: you have access to \\ComputerName\c$), you can also view the crashes of the other computers on your network remotely. In order to do that, simply go to 'Advanced Options' (Ctrl+O) and type the MiniDump folder of the remote computer, for example: \\MyComp\c$\Windows\MiniDump.